
Let's see. Average spike frequency is the probability that the damage lies in [D,D*1.05]. You can compute it, it is
Originally Posted by Motenten

(20*ln(1.05)*(1-q)/(b-a)+20*q)*0.05=ln(1.05)*(1-q)/(b-a)+q
The average non spike freqency is
(20*ln(1.05)*(1-q)/(b-a))*(b-1.05*a-D*0.05)
The ratio betwwen the two is
( ln(1.05)*(1-q)/(b-a)+q )
____________________________________
(20*ln(1.05)*(1-q)/(b-a))*(b-1.05*a-D*0.05)
(20*ln(1.05)*(1-q)/(b-a))*(b-1.05*a-D*0.05)
When you're near 1.0, with the spike right in the middle, the average spike frequency is about 5x the average non-spike frequency.
Just a rough review from Masa's data..
What I'm looking at:
Find the average frequency of all values aside from the 1.0 spike and any tail ends (artifacts of the 1.05 randomizer).
ln(1.05)*(1-q)/(b-a)+q -Subtract that average frequency from the frequency values of the spike values.
Sum up the remaining spike values.
(20*ln(1.05)*(1-q)/(b-a))*(b-1.05*a-D*0.05)
not simple
Compare that sum with the grand total of all damage value frequencies to see what percentage of all generated damage values are encompassed in the artificial spike.
[ ln(1.05)*(1-q)/(b-a)+q -
(20*ln(1.05)*(1-q)/(b-a))*(b-1.05*a-D*0.05) ]
________________________________________________
ln(1.05)*(1-q)/(b-a)+q
and ..? Is that supposed to be q?
As seen in the formula above this little to no relation with the parameter q which governs the spike.What I found:
Below 1.0 cRatio, down to ~0.8 (where max damage was still above 1.0), ~35% of all values came from the spike pool.
As cRatio dropped towards 0.75 (where max damage was capped at 1.0), the pool size dropped to about 25% of all values.
Not enough data (in this spreadsheet) below 0.75 to see how the trend continued.
Above 1.0 cRatio the pool size fluctuated from ~30% to ~37%. Either 33% or 35% would be believable.
As cRatio increases above 1.25, such that the min damage hits and sticks to 1.0, the percentage of the overall damage frequencies that are made up by the spike pool drop in a fairly linear fashion, reaching 12% at 1.4 cRatio.
Hmm, yeah I did not say that I said q didn't vary with r. I said that between 0.75 and 1.25 the spike frequency IS 30% (or almost in the limit of the confident intervals) and outside of this interval it decreases (probably linearly) to 0.As such you can't simply say that 30% (or whatever) of the time you generate a spike value, and the rest of the time you generate a value in the min::max range.
average=1.025*( (1-q)*(b+a)/2 + q*DMG)One might posit, then, that the chance of generating a frequency spike value is dependant on the total min:max range available.
Formulation:
(max - min)/baseDamage + fraction of total values in the spike
where max and min are corrected to generally exclude the 1.05 spread tails.
That formulation consistantly resulted in a final value of just about 0.9 (with rounding, between 0.89 and 0.91).
So, your threshhold for U would be: 1 - ((max - min)/baseDamage) - 10%
Not sure why there would be the extra -10% there, but could probably be explained based on expectations for the min::max range compared to base damage.
And this finally creates a formula that I'm comfortable with in terms of how the spike is generated. Still needs more work to calculate an average damage value based only on cRatio, though, and you can't completely ignore the min and max values (the a and b you mention in your post).
q(r)= 0.3 if 0.75<r<1.25
q(r)=0.6 - 1.2(r-1) if 1.25<r<1.5
q(r)=0.6+1.2(r-1) if 0.5<r<0.75
q(r)=0 otherwise.
Those formula are on the wiki.
The average is basically a second order polynomial outisde of 0.75 and 1.25 and linear inside assuming a & b are actually linear by part.
r=1,1.25, and 0.75 have 2k sample size nearly in my tests, they are very precise and q is about 0.3 (0.29 to 0.34)
for r=1.5 I verifed that there is no spike q=0.
I need data at r=0.5 to prove that there is no spike either.
So no masa I don't use rough approximation, I know my shit and My model is correct modulo an more accurate methode to determine q which I've yet to see.
Thread: defense, attack, damage
-
03-03-2012 09:41 PM #21Player


- Join Date
- Mar 2011
- Location
- Windy
- Posts
- 1,429
- Character
- Pimpchan
- World
- Quetzalcoatl
- Main Class
- MNK Lv 99
(0)Last edited by MarkovChain; 03-03-2012 at 09:55 PM.
Ultimate DPS simulator
https://docs.google.com/file/d/0B7wbcilaHsTecldhZm94a1gtZnM/edit
-
03-03-2012 10:43 PM #22Player
- Join Date
- Mar 2011
- Location
- Windy
- Posts
- 1,429
- Character
- Pimpchan
- World
- Quetzalcoatl
- Main Class
- MNK Lv 99
My next plans are to show that the model matches the data just like the 2 graphs I posted so far for all the data I got and then to show that the frequency spike, the average and the variance coincide for each. Since I'm getting the value of 'q' by reversing the frequency spike expression, that's two verifications for each data set and you I can also compare n-th order moments too, shouldn't be too hard.
(0)
Ultimate DPS simulator
https://docs.google.com/file/d/0B7wbcilaHsTecldhZm94a1gtZnM/edit
-
03-04-2012 01:56 AM #23Player
- Join Date
- Mar 2011
- Location
- Windy
- Posts
- 1,429
- Character
- Pimpchan
- World
- Quetzalcoatl
- Main Class
- MNK Lv 99
First let's look at the counterstance data (me getting hit by chigoes)
counterstance_40:=[[86,6],[87,10],[88,20],[89,22],[90,41],[91,34],[92,32],[93,38],[94,26],[95,30],[96,35],[97,35],[98,42],[99,21],[100,31],[101,39],[102,29],[103,28],[104,24],[105,28],[106,38],[107,36],[108,48],[109,28],[110,34],[111,30],[112,24],[113,32],[114,32],[115,47],[116,39],[117,25],[118,40],[119,35],[120,38],[121,34],[122,31],[123,30],[124,28],[125,29],[126,32],[127,28],[128,37],[129,29],[130,38],[131,25],[132,27],[133,33],[134,33],[135,42],[136,40],[137,36],[138,34],[139,46],[140,41],[141,38],[142,33],[143,35],[144,18],[145,20],[146,10],[147,16],[148,10],[149,5],[150,2]]
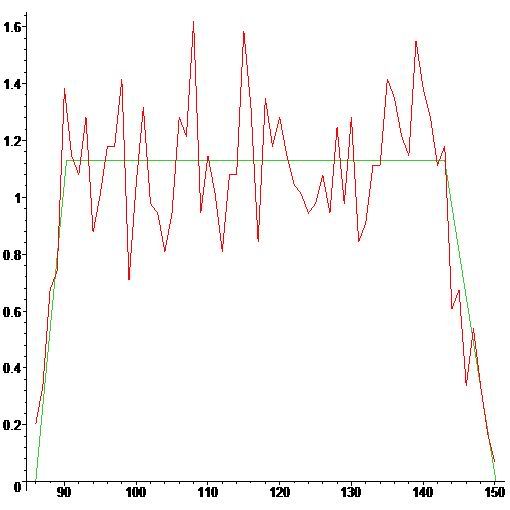
green : model , red : data
I compute reduced moments : m1=E(d),sigma=standard dev, m2=E(d^2)^(1/2), m3=E(d^3)^(1/3) in each case.
DATA : m1=117.2447624,sigma=17.09798864,m2 :=118.4849169,m3=119.6849566
MODEL :m1=117.3622996,sigma=16.94823656,m2=118.5798168,m3=120.9018511
I win. (the model works with q=0 in this case, and we are @ very high, though unknow, pdif, probably @ cap).(0)Last edited by MarkovChain; 03-04-2012 at 01:58 AM.
Ultimate DPS simulator
https://docs.google.com/file/d/0B7wbcilaHsTecldhZm94a1gtZnM/edit
-
03-04-2012 03:57 AM #24Player
- Join Date
- Mar 2011
- Location
- Windy
- Posts
- 1,429
- Character
- Pimpchan
- World
- Quetzalcoatl
- Main Class
- MNK Lv 99
Using H2H404_ATT467_STR91_D0
a=34,b=61,DMG=47
data : m := 48.10173160,sigma := 6.742996786,m2 := 48.57205564,m3 := 49.03565994
model : m:=48.49419660,sigma=6.723842029,m2=48.97687781,m3=57.38601253
at least the average and the variance match. m3 doesn't match 1300 sample only though. Using q=0.3 for this one.
H2H427_ATT429_STR176_D42 (the graph that I put earlier in the thread)
a=63,b=123,
data: m= 100.3947368,sigma := 14.79139228,m2 := 101.4785123,m3 := 102.4726554
model : m=100.2753381,sigma=14.56868085,m2=101.2691851,m3=121.3597252
It's interesting to see that in those 2 models, any value of q between 0.25 and 0.35 approximately matches for the average and standard deviation. It's starting to be different outside of those values. This is why I said It's hard to have a good approximation of q. The best I found is the expression of the spike frequency.(0)
Ultimate DPS simulator
https://docs.google.com/file/d/0B7wbcilaHsTecldhZm94a1gtZnM/edit
-
03-04-2012 06:08 AM #25Player


- Join Date
- Aug 2011
- Posts
- 23
- Character
- Masamunai
- World
- Cerberus
- Main Class
- THF Lv 90
From my data, i kinda "felt" ( so i can be wrong and just placebo effect ) that the spike intensity depends on BaseDMG:
The higher BaseDMG is, the more values the distribution will have, the less "intense" the spike will be;
If using DMG1 weapon, distribution will have few values and spike immediately gets to very high %.
For determining q, why motenten's method wouldnot work ? you don't have enough parses ? (Note i've asked this question since my 1st post and no answer). I'm not sure i understood correctly the problem there...
And finally, i never ever said your model approach isnot "correct" in the sense of mimicing observed frequency parses, but i said this approach is deterministic, ie according to you, SE put this spike on purpose...
A non deterministic way is to use the definition of a pseudo RNG defined as Y=START+INT(RANGE*Generator), strangely its main signature is a spike at start, from there you can guess how it can be adapted to our problem, and this without using any parameter q or whatever. Think of this spike like an "artifact" occuring only when pDIF=1 is generated. An example of it is what Raellia posted at Mathy BG forum.
Saying this doesnot turn in any way your approach as "not correct", ok ?(0)Majestic LS
-
03-04-2012 07:56 AM #26Player
- Join Date
- Mar 2011
- Location
- Windy
- Posts
- 1,429
- Character
- Pimpchan
- World
- Quetzalcoatl
- Main Class
- MNK Lv 99
Because the proportion of the data supposedely inherent to the spike is not a simple function of q.
Originally Posted by Masamunai
The only thing that can remove the uncertainity of what q is, is testing a range of pdif and study the variation of q between that, because increasing the the data doesn't seem to increase the precision on it very much.you don't have enough parses ? (Note i've asked this question since my 1st post and no answer). I'm not sure i understood correctly the problem there...
What's that ? This is a uniform variable on a range of integer numbers ? There is no spike. (assuming generator is uniform).Y=START+INT(RANGE*Generator)(0)Last edited by MarkovChain; 03-04-2012 at 08:13 AM.
Ultimate DPS simulator
https://docs.google.com/file/d/0B7wbcilaHsTecldhZm94a1gtZnM/edit
-
03-04-2012 10:43 AM #27Player
- Join Date
- Mar 2011
- Location
- Windy
- Posts
- 1,429
- Character
- Pimpchan
- World
- Quetzalcoatl
- Main Class
- MNK Lv 99
Ok I'm actually agreeing with this, it's also interesting because it's puts q=0 at high pdif (1.5) or low pdif (<0.5) matches about for the rest of the datas. I concluded to this form after analyzing the behavior of the distribution for 1.25<r<1.5. In this range the frequency of the spike on the lower bound decreses when the upper bound increases ; so I made the hypothsis that decrease/increase at the same rate and that the average, which is
Originally Posted by Motenten
m=1.025*( (1-q)*(a+b)/2+qDMG) in this range, would then vary liearly (since a is constant). This necessarily brings that q+(b-a)/DMG is a constant. In this case it's around 0.9.
So in other words, the renormlized average damage would be
m=1.025*( (1-(0.9-(b-a)))*(a+b)/2+(0.9-(b-a)) )
So the damage would ge generated by the following program
U:=rand(0..1)
V:=rand(a..b)
W=rand(1..1.05)
If U<0.9-(b-a) then DMG*W
else V*W
end if;
So I suppose this is where you guys that studied the expression of a & b with respect to r explain what the value of b-a is at r>1.5 or r<0.5. Wiki formula at low pdif indicates b-a=0.9 so it matches and that should be the case at high pdif.(0)Last edited by MarkovChain; 03-04-2012 at 10:58 AM.
Ultimate DPS simulator
https://docs.google.com/file/d/0B7wbcilaHsTecldhZm94a1gtZnM/edit
-
03-04-2012 08:45 PM #28Player
- Join Date
- Aug 2011
- Posts
- 23
- Character
- Masamunai
- World
- Cerberus
- Main Class
- THF Lv 90
... and BaseDMG is what i implied in my previous post, further confirmed with Motenten formula for U=1-(b-a)/BaseDMG -> the higher BaseDMG is, the higher U is, ie freq spike less "potent" compared to other values.
Originally Posted by MarkovChain
At 1st glance, yea... until you plot and discover it actually has an artifact : a spike which position within the freq chart is static at Y=START. Here is an example (doesnot match parses tough, it's just to picture the thing) Originally Posted by MarkovChain
And now, from your last post, does proving that spike intensity decreases linearly from cRatio=1 to 1.5 and to 0.5 lead to a linear average dmg formula in the range 0.5<=cRatio<=1.5 ? Hoping the demonstration will end up to the regression formula i posted earlier, at least would be proven mathematically (0)
(0)Last edited by Masamunai; 03-04-2012 at 09:04 PM.
Majestic LS
-
03-04-2012 09:35 PM #29Player
- Join Date
- Mar 2011
- Location
- Windy
- Posts
- 1,429
- Character
- Pimpchan
- World
- Quetzalcoatl
- Main Class
- MNK Lv 99
(b-a)/DMG is independant of the weapon DMG so nope. The Bernouilli variable doesn't depend on DMG. It i s only a function of r and is about equal to the expression I gave earlier.
q(r)= 0.3 if 0.75<r<1.25
q(r)=0.6 - 1.2(r-1) if 1.25<r<1.5
q(r)=0.6+1.2(r-1) if 0.5<r<0.75
q(r)=0 otherwise.
cannot be a lot more precise than this or q=0.9-(b-a) until b and a are explicitely expressed
Also
m=1.025*( (1-(0.9-(b-a)))*(a+b)/2+(0.9-(b-a)) )
it's linear when b-a is constant otherwise doesn't seem to be so...(0)Last edited by MarkovChain; 03-04-2012 at 10:20 PM.
Ultimate DPS simulator
https://docs.google.com/file/d/0B7wbcilaHsTecldhZm94a1gtZnM/edit
-
03-05-2012 04:49 AM #30Player
- Join Date
- Aug 2011
- Posts
- 23
- Character
- Masamunai
- World
- Cerberus
- Main Class
- THF Lv 90
huh? isnot BaseDMG = WeaponDMG + fSTR ?
Looks like to me you are misunderstanding what i'm talking about, im just following what motenten said :
... and yes Max and Min depends on r. Originally Posted by Motenten
(0)Last edited by Masamunai; 03-05-2012 at 05:51 AM.
Majestic LS
 Reply With Quote